Rethinking the benchmark: improving how digital public services are compared across countries
For several years, the European Commission’s annual eGovernment Benchmark has assessed digital public services from different countries against several indicators. They fall under 4 broad themes:
User-centricity – the extent to which services are online and accessible.
Transparency – the openness of communication about how the services are delivered.
Key enablers – the technology in place allowing digital services to be delivered.
Cross-border mobility – the ease with which citizens abroad can use the services.
But the results from this method of assessment have sometimes seemed at odds with users’ own experiences: the 2020 European Benchmark report awarded an astonishingly high average score to EU countries of 87% on measures of usability.
The European Commission commissioned the Lisbon Council, with support from Public Digital, to develop and pilot new indicators on the user-centricity/usability dimension. This found a much lower average score for pilot countries (54%).
The problem
The existing eGovernment Benchmarking exercise used 3 indicators to assess user-centricity:
Online availability – whether services for certain life events (such as starting a business and moving home) are online; whether there is only information about the service online, or whether there is no information online.
Mobile friendliness – whether websites are optimised for mobile use.
User support – whether there are complaint procedures (including channels other than a website). This could include discussion forums or social media, feedback mechanisms, contact details, a demonstration or live chat, and Frequently Asked Questions section (FAQs).
Many of these measures are quite basic – they don’t get to the quality of a user’s actual experience. Some could be easily gamed too. For example, merely having a FAQs section would count in a service’s favour, even if it didn’t prove useful to the user.
The solution
Last autumn, we held a workshop alongside the Lisbon Council. We wanted to hear from experts from a range of digital disciplines to suggest possible new usability indicators that might give a stronger sense of a citizen’s experience and provide criteria for what a good experience should look like.
There was discussion about the general framing of possible indicators, including whether it would be possible to focus on outcomes (essentially: did the user get what they wanted from the service?); move towards real-time indicators rather than lagging ones, and whether there were ‘quantitative hacks’ to measure qualitative experiences.
Most of the suggested measures fell under 3 areas:
Quantitative measures – including time taken to complete a service journey, duration of page load and number of clicks (and measures looking at cost per transaction of running the service) with tools such as web.dev’s tool based on Lighthouse now available.
Proxy or process measures – whether teams building digital services had the right procedures and resources in place, such as using metrics to track service performance, bringing together a multidisciplinary team and listening to user research.
Service journey and experience indicators – expectation setting, for example, giving an accurate sense of how long a service journey would take), accessibility (use of plain language), help and feedback (error messages, whether complaints were resolved), and overall success of the service (whether the user got the right outcome).
There was also a discussion about the existing methodology for the eGovernment Benchmarking, which involves assessment by mystery shoppers at a particular point in time and on portals to services rather than the services themselves. Workshop participants felt that, in an ideal world, services would be tested more than once a year, they'd involve real users in real situations, and there'd be opportunity be able to go deeper on the most-used digital services. However, changing the methodology was outside the remit of this work.
The Lisbon Council used these suggestions, and others, from literature reviews and interviews with member states and experts in digital government to come up with a long list of possible indicators. They then whittled these down, according to their relationship to usability theory, alignment with policy priorities and technical feasibility.
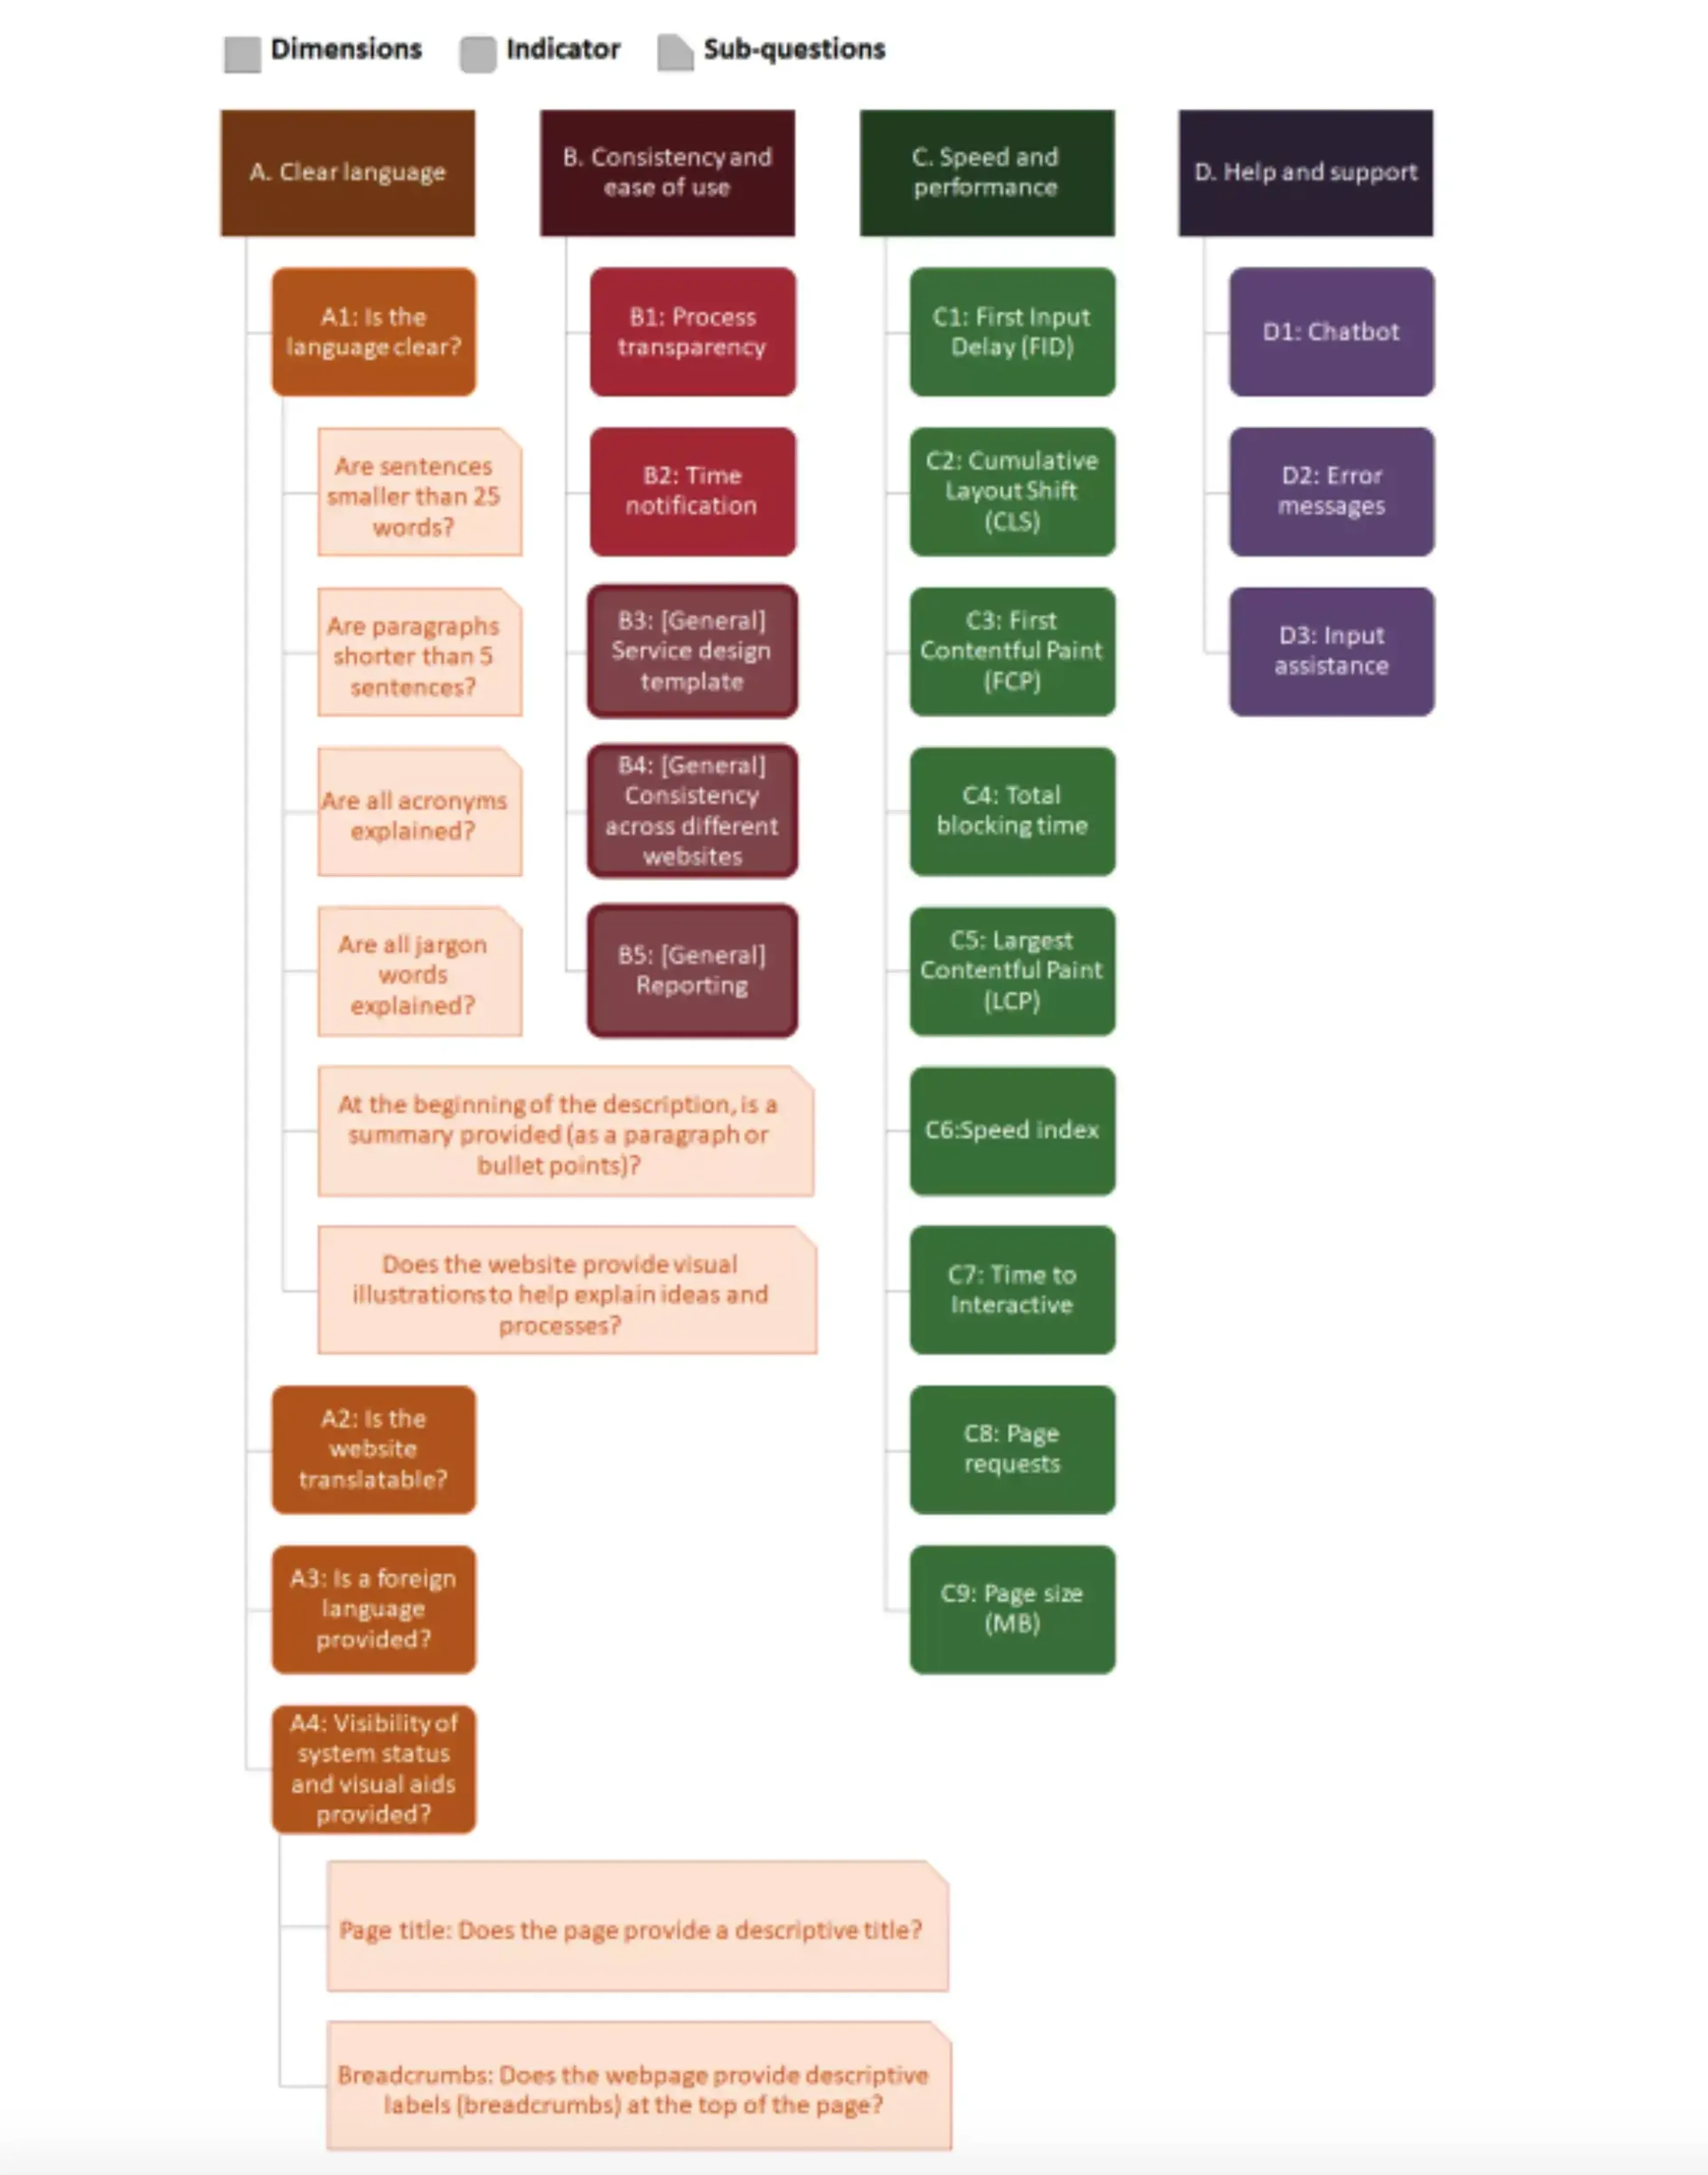
The indicators that remained were grouped into 4 dimensions:
Clear language – including the use of summaries, short sentences and paragraphs and testing how easily the words could be translated
Consistency and ease of use – such as transparency about the process and use of design templates.
Speed and performance –such as loading times and page size.
Help and support – such as the availability of a chatbot and use of error messages.
Under each of the 4 dimensions, there are ‘indicators’ which act as a list of things to consider relating to the category they fall under. There are also yes/no ‘sub-questions’ under some of the indicators which act as extra prompts.
Mystery shoppers then piloted these new indicators against 16 services for 3 countries – Czech Republic, Denmark, and Italy. The results were analysed and assessed and shared with the countries to detect any possible mistakes. Far from the average 91% score in the existing eGovernment Benchmarking, the 3 countries in the pilot scored an average of 54%.
Next steps
As a result of the pilots, the Lisbon Council removed a couple of the pilot indicators (for clear language) and made efforts to improve several other indicators. The ‘speed and performance’ category was the clearest one to test, with the others all proving more difficult.
Nonetheless, these new indicators can be used to give a more accurate reflection of the usability of digital services, providing a more useful measure of what is working well, what could work better and which countries to look towards to learn from.
Whatever limitations and remaining imperfections in an exercise like the eGovernment Benchmarking, governments can learn from the results, build better digital services, and ultimately make life better for their citizens.
-
This piece of work was carried out by David Osimo, Nathan da Silva Carvalho, Cristina Moise from the Lisbon Council, and Angie Kenny and Gavin Freeguard representing Public Digital.